For most of U.S. history, people of different races have lived on separate streets, gone to separate schools and occupied separate parts of town. In the South, racial segregation was once the law of the land. While the region has made progresstoward integration in recent years, most major Southern cities remain segregated today.
Data guru Nate Silver crunched the numbers last week on theFiveThirtyEight blog, looking at the 100 largest cities in the country and ranking them by levels of racial segregation. Chicago, long plagued by stark racial divisions, came in at number one. Next on the list was Atlanta, which beat out St. Louis, Philadelphia and Milwaukee for the number two spot. Baton Rouge and New Orleans also made the list of the 10 most segregated U.S. cities.
Here’s how the Southern cities included on Silver’s list stack up:
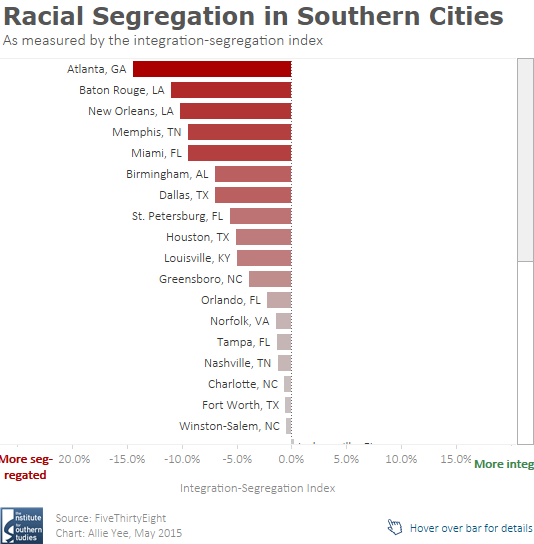
By this measure, Atlanta is the most segregated city in the South and the second-most segregated in the country. With a population that’s 54 percent black and 36 percent white, it has a citywide diversity index of 56.8 percent. But its neighborhood diversity index is just 30.7 percent, putting it well below the red curve with an integration-segregation index of -14.5 percent.
Atlanta’s lack of neighborhood diversity is clearly shown in the dot map below created by Dustin Cable. Whites, represented by blue dots, live largely in the northeastern part of the city while blacks (green dots) are in the city center and to the southwest. Atlanta was also 5 percent Hispanic in 2010, the census year that all these numbers are based on, but few of them (orange dots) are clustered in the city center. Asians, who were 3 percent of the city’s population and are represented by red dots, are concentrated in small clusters in the city center.

Meanwhile, Louisiana is home to two of the most segregated cities in the South: Baton Rouge and New Orleans. The cities’ residents are mostly black and white, with the races clustered in certain areas. Both cities’ diversity indices are over 50 percent but their neighborhood diversity indices are in the low 30s, putting their integration-segregation indices at just over -10 percent. While there seem to be some pockets of mixed-race neighborhoods and immigrant communities, the two cities are clearly divided into white and black parts of town.


Further down the list of the South’s most segregated cities is Dallas. With a significant Hispanic population of over 40 percent in 2010 as well as sizable black and white populations, Dallas has a high citywide diversity index of 67.4 percent. Its neighborhood diversity index, though, falls to 45.3 percent, for an integration-segregation index of -7.0 percent, ranking sixth worst in the South.

Just outside of Dallas, though, are the four most integrated cities in the South: Garland, Plano, Arlington and Irving. These suburbs have high citywide diversity indices in the 60 to 70 percent range, reflecting a broader nationwide trend of diversifying suburbs. The dot map below shows multi-colored areas surrounding Dallas proper.

However, growing diversity in the suburbs doesn’t necessarily result in integrated communities. As in cities, suburban growth in black, Hispanic and Asian residents has led to greater segregation and racial tension in many places as was starkly illustrated by recent events in Ferguson, Missouri, a suburb of St. Louis. While Silver’s current analysis focused on city-level data, he says a future one will look at segregation across broader metropolitan areas.